

 India Exports
India’s exports roar back: Trade jumps 13.6% to $80.8 billion in April
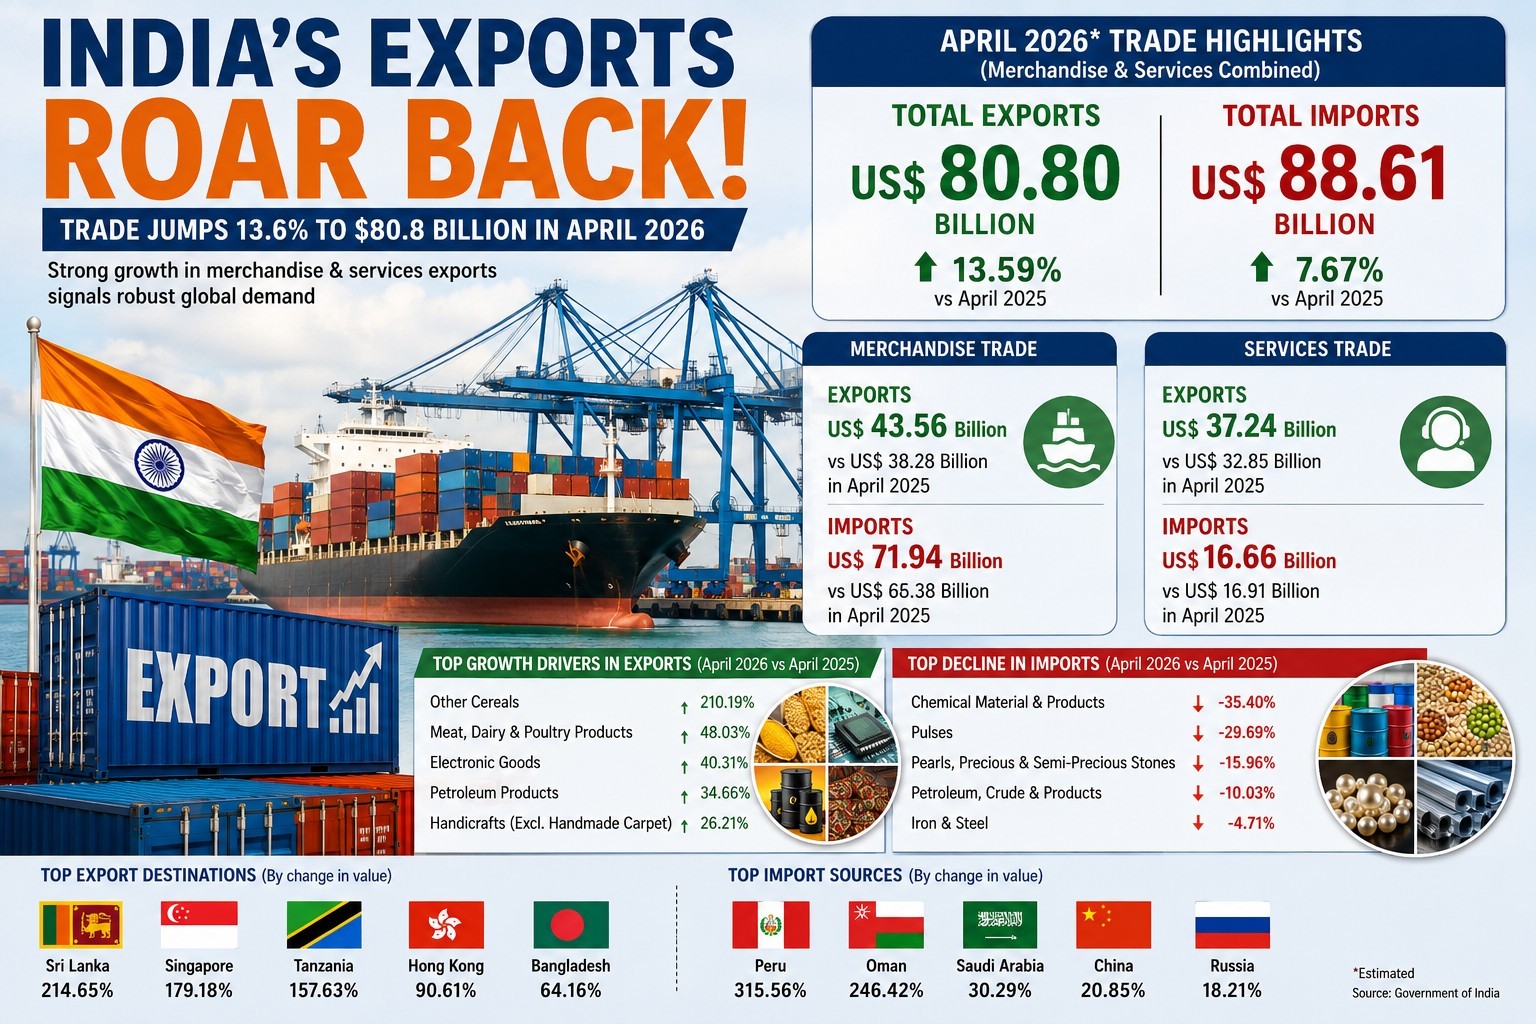
India’s total exports (merchandise and services combined) for April 2026 are estimated at US$ 80.80 billion, registering a robust 13.59 percent growth compared to April 2025, according to government data released on Friday.
Total imports (merchandise and services combined) during April 2026 are estimated at US$ 88.61 billion, reflecting a 7.67 percent increase over the corresponding period last year.
Merchandise Trade
Merchandise exports during April 2026 stood at US$ 43.56 billion, compared to US$ 38.28 billion in April 2025, marking healthy year-on-year growth.
Merchandise imports rose to US$ 71.94 billion, up from US$ 65.38 billion in April 2025.
Non-petroleum and non-gems & jewellery exports reached US$ 31.64 billion, compared to US$ 28.66 billion a year earlier.
Meanwhile, non-petroleum and non-gems & jewellery imports (excluding gold, silver and precious metals) increased to US$ 45.87 billion, against US$ 39.75 billion in April 2025.
Services Trade
India’s services exports for April 2026 are estimated at US$ 37.24 billion, up from US$ 32.85 billion in April 2025, registering a strong 13.36 percent growth.
Services imports are estimated at US$ 16.66 billion, slightly lower than US$ 16.91 billion recorded in April 2025.
Key Export Growth Drivers
Several sectors posted impressive export growth during April 2026 compared to the same month last year. These include:
Other Cereals: 210.19%
Meat, Dairy & Poultry Products: 48.03%
Electronic Goods: 40.31%
Petroleum Products: 34.66%
Handicrafts (excluding handmade carpets): 26.21%
Marine Products: 14.74%
Minerals including processed minerals: 13.85%
Iron Ore: 11.46%
Oil Seeds: 11.32%
Carpets: 9.93%
Engineering Goods: 8.76%
Coffee: 7.51%
Organic & Inorganic Chemicals: 7.31%
Drugs & Pharmaceuticals: 7.12%
Plastic & Linoleum: 5.28%
Man-made Yarn/Fabrics/Made-ups: 2.34%
Cotton Yarn/Fabrics/Handloom Products: 0.57%
Leather & Leather Products: 0.36%
Decline in Imports Across Select Segments
Imports declined in several categories during April 2026, including:
Chemical Material & Products: -35.40%
Pulses: -29.69%
Pearls, Precious & Semi-Precious Stones: -15.96%
Newsprint: -12.54%
Petroleum, Crude & Products: -10.03%
Wood & Wood Products: -8.36%
Textile Yarn/Fabric/Made-up Articles: -7.17%
Cotton Raw & Waste: -6.10%
Iron & Steel: -4.71%
Machine Tools: -0.73%
Pulp & Waste Paper: -0.24%
Top Export Destinations
The top five export destinations showing strong growth in April 2026 compared to April 2025 were:
Sri Lanka: 214.65%
Singapore: 179.18%
Tanzania: 157.63%
Hong Kong: 90.61%
Bangladesh: 64.16%
Top Import Sources
India’s top five import sources recording significant growth during April 2026 were:
Peru: 315.56%
Oman: 246.42%
Saudi Arabia: 30.29%
China: 20.85%
Russia: 18.21%
The latest trade data highlights India’s resilient export momentum, led by strong performance in services, electronics, agriculture, and petroleum products, even as selective import moderation signals evolving domestic demand patterns.
Support Our Journalism
We cannot do without you.. your contribution supports unbiased journalism
IBNS is not driven by any ism- not wokeism, not racism, not skewed secularism, not hyper right-wing or left liberal ideals, nor by any hardline religious beliefs or hyper nationalism. We want to serve you good old objective news, as they are. We do not judge or preach. We let people decide for themselves. We only try to present factual and well-sourced news.
Support objective journalism for a small contribution.